Find a device that consumes bandwidth in Firebox WebUI

Hi all,
Under DASHBOARD - Interfaces - Bandwidth I see this.
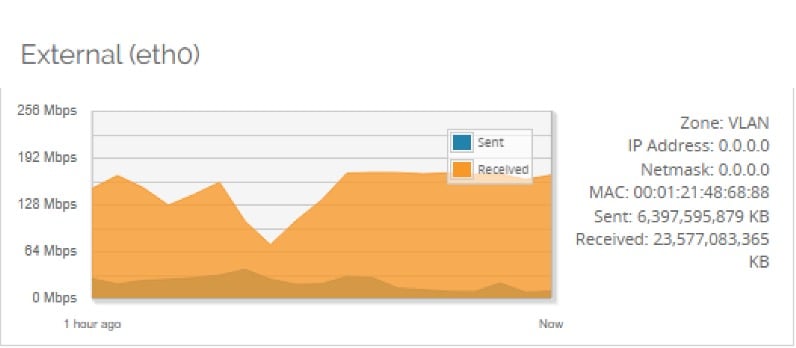
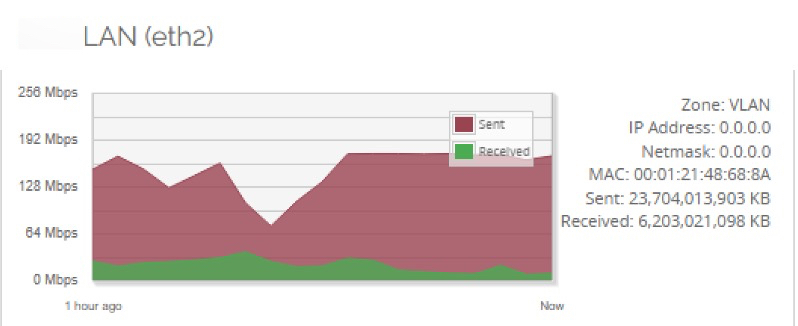
As far as I understand it is a continuous bandwidth utilization.
How do I find a device that utilizes bandwidth in WebUI?
0
Sign In to comment.
Comments
Dashboard -> Firewatch
https://www.watchguard.com/help/docs/help-center/en-US/Content/en-US/Fireware/system_status/firewatch_web.html
Firewatch, the bigger the square, the more bandwidth it's using.
The front panel dashboard may also provide clues based on the top client log item.
-James Carson
WatchGuard Customer Support
Thanks guys.
Another question I have, under DASHBOARD - Interfaces the chart shows bandwidth utilization but doesn't show timing.
Is it configurable?
If not what can I use instead to see time scale.
Top right of that page - is the graph interval of data being displayed - from 20 mins, to 7 days - 6 options in total
Yeah I know I can select graph interval.
However, I need to see time interval on the graph itself.
Say, I select 7 days.
However, on the chart I don't see MON, TUE, WED, THU and etc.
Same for daily, I don't see 09.00, 10.00, 11.00 and etc.
Can I see that with built-in tools or should install or use some add-ons?
There is no option to see the days or hours on that graph.
Other options:
1) log to Dimension - Top Clients list. Appropriate logging is needed to get accurate results
Dimension is free, but it runs in a VM, and requires an active support license on your firewall for reporting to work.
2) if you have managed switches, use SMPT tools to graph switch & firewall port bandwidth usage. PRTG & MRTG are some examples. MRTG is free. PRTG has a free version which monitors up to 100 measuring points.
3) WSM Firebox System Manager - HostWatch shows real time usage of existing sessions.
About HostWatch
https://www.watchguard.com/help/docs/help-center/en-US/Content/en-US/Fireware/fsm/hostwatch_about_wsm.html?Highlight=hostwatch